Latest notes for members and visitors
Bottom Line Up Front: Provide a forum to disseminate my simple, financially sound, reallocation of the Thrift Savings Plan Funds at the lowest possible cost to the customer while generating excess Alpha over other allocation methods.

TSP Coach is dedicated to ensuring military, civilian and retired members of the US Government have the best information when making TSP investment allocation decisions. My investment strategy has over 21 years of proven success, and now you can follow along as I change my allocations no more than once a month. My service is perfect for the investor that wants to maximize their return without high fees, complex newsletters, market timing, or other fancy strategies that rely on the 'intuition' of the plan manager. I already calculate my allocation percentages every month, and I want to share my success with you.
Simple pricing — monthly or yearly access to the allocation page.
By subscribing through PayPal or Square you receive a username and password by email for the monthly allocation page. Plans match the Subscribe section below ($7 monthly / $60 yearly).
Simple, once a month, changes to our allocation and TSP Fund investment percentages have achieved returns far exceeding the buy and hold method. Additionally, our program outperforms all of the other respectable TSP newsletter services at a much lower cost.
Annualized vs core TSP funds — same “Annualized” row as the full table (each series from its own first available price).
TSP Coach 14.01% vs C Fund 11.23% (+2.78 percentage points)
Lifecycle funds appear in the full table below. Their annualized rates are not comparable across different inception dates (newer L funds can show high or low rates on short histories). Prefer the Life return KPI and Life row for the long TSP Coach story (since 2004).
Multi-year and calendar-year returns next to every Lifecycle fund and G, F, C, S, and I. Life is total growth over each series’ available history (TSP Coach from 2004); Annualized is the compounded yearly rate over that same history—so newer L funds are not equivalent long-term benchmarks.
Swipe sideways for L funds and G / F / C / S / I · Year + TSP Coach stay fixed on the left
| Year1 | TSP Coach |
|---|---|
| Life | 1672.82% |
| 20 Years | 1131.10% |
| 15 Years | 615.40% |
| 10 Years | 277.76% |
| 5 Years | 74.86% |
| 3 Years | 60.42% |
| 2005 | 10.98% |
| 2006 | 23.57% |
| 2007 | 10.68% |
| 2008 | -8.50% |
| 2009 | 16.83% |
| 2010 | 25.23% |
| 2011 | -1.61% |
| 2012 | 27.39% |
| 2013 | 34.94% |
| 2014 | 12.67% |
| 2015 | 1.56% |
| 2016 | 5.37% |
| 2017 | 17.89% |
| 2018 | -6.56% |
| 2019 | 29.24% |
| 2020 | 37.47% |
| 2021 | 17.60% |
| 2022 | -15.35% |
| 2023 | 22.25% |
| 2024 | 13.28% |
| 2025 | 18.36% |
| 2026 | 20.212% |
| Annualized | 14.01% |
| As of: | 07/31/2026 |
| L Income | L 2030 | L 2035 | L 2040 | L 2045 | L 2050 | L 2055 | L 2060 | L 2065 | L 2070 | L 2075 | G Fund | F Fund | C Fund | S Fund | I Fund |
|---|---|---|---|---|---|---|---|---|---|---|---|---|---|---|---|
| 165.15% | 360.56% | 92.57% | 430.46% | 106.24% | 113.01% | 140.79% | 140.76% | 140.72% | 42.67% | 24.62% | 90.80% | 101.79% | 931.68% | 812.62% | 386.05% |
| 151.08% | 323.53% |   | 384.41% |   |   |   |   |   |   |   | 75.16% | 93.34% | 760.22% | 582.96% | 226.76% |
| 104.72% | 247.93% |   | 301.46% |   |   |   |   |   |   |   | 46.53% | 39.79% | 663.60% | 416.84% | 208.82% |
| 68.88% | 139.00% |   | 165.67% |   |   |   |   |   |   |   | 33.29% | 15.35% | 306.29% | 198.81% | 161.85% |
| 32.86% | 47.84% | 51.07% | 53.69% | 55.76% | 58.08% | 68.41% | 68.38% | 68.36% |   |   | 20.78% | -1.53% | 81.86% | 33.79% | 63.32% |
| 26.85% | 43.45% | 47.28% | 50.44% | 53.17% | 55.96% | 66.01% | 66.01% | 66.00% |   |   | 14.03% | 11.74% | 69.99% | 56.81% | 63.51% |
|   |   |   |   |   |   |   |   |   |   |   | 4.49% | 2.40% | 4.96% | 10.45% | 13.63% |
| 7.59% | 15.00% |   | 16.53% |   |   |   |   |   |   |   | 4.93% | 4.40% | 15.79% | 15.30% | 26.32% |
| 5.56% | 7.14% |   | 7.36% |   |   |   |   |   |   |   | 4.87% | 7.09% | 5.54% | 5.49% | 11.43% |
| -5.09% | -27.50% |   | -31.53% |   |   |   |   |   |   |   | 3.75% | 5.45% | -36.99% | -38.32% | -42.43% |
| 8.57% | 22.48% |   | 25.19% |   |   |   |   |   |   |   | 2.97% | 5.99% | 26.68% | 34.85% | 30.04% |
| 5.74% | 12.48% |   | 13.89% |   |   |   |   |   |   |   | 2.81% | 6.71% | 15.06% | 29.06% | 7.94% |
| 2.23% | -0.31% |   | -0.96% |   |   |   |   |   |   |   | 2.45% | 7.89% | 2.11% | -3.38% | -11.81% |
| 4.77% | 12.61% |   | 14.27% |   |   |   |   |   |   |   | 1.47% | 4.29% | 16.07% | 18.57% | 18.62% |
| 6.97% | 20.16% |   | 23.23% |   |   |   |   |   |   |   | 1.89% | -1.68% | 32.45% | 38.35% | 22.13% |
| 3.77% | 5.74% |   | 6.22% |   |   |   |   |   |   |   | 2.31% | 6.73% | 13.78% | 7.80% | -5.27% |
| 1.85% | 1.04% |   | 0.73% |   |   |   |   |   |   |   | 2.04% | 0.91% | 1.46% | -2.92% | -0.51% |
| 3.58% | 7.07% |   | 7.90% |   |   |   |   |   |   |   | 1.82% | 2.91% | 12.01% | 16.35% | 2.10% |
| 6.19% | 14.54% |   | 16.77% |   |   |   |   |   |   |   | 2.33% | 3.82% | 21.82% | 18.22% | 25.42% |
| 0.71% | -3.58% |   | -4.89% |   |   |   |   |   |   |   | 2.91% | 0.15% | -4.41% | -9.26% | -13.43% |
| 7.60% | 17.60% |   | 20.69% |   |   |   |   |   |   |   | 2.24% | 8.68% | 31.45% | 27.97% | 22.47% |
| 5.15% | 11.26% |   | 13.16% |   |   |   |   |   |   |   | 0.97% | 7.50% | 18.31% | 31.85% | 8.17% |
| 5.42% | 12.37% | 13.43% | 14.51% | 15.40% | 16.34% | 19.90% | 19.90% | 19.90% |   |   | 1.38% | -1.46% | 28.68% | 12.45% | 11.45% |
| -2.70% | -10.32% | -11.65% | -12.90% | -14.03% | -15.05% | -17.60% | -17.61% | -17.62% |   |   | 2.98% | -12.83% | -18.13% | -26.26% | -13.94% |
| 8.99% | 15.76% | 16.91% | 18.04% | 19.03% | 20.00% | 23.31% | 23.30% | 23.31% |   |   | 4.22% | 5.58% | 26.25% | 25.30% | 18.38% |
| 7.37% | 11.52% | 12.18% | 12.85% | 13.42% | 14.02% | 16.28% | 16.28% | 16.28% |   |   | 4.40% | 1.33% | 24.96% | 16.93% | 4.27% |
| 9.36% | 15.17% | 16.27% | 17.31% | 18.20% | 19.07% | 21.87% | 21.88% | 21.88% | 21.89% |   | 4.44% | 7.21% | 17.85% | 11.38% | 32.45% |
| 5.18% | 7.89% | 8.93% | 9.48% | 9.96% | 10.45% | 12.36% | 12.36% | 12.36% | 12.36% | 12.36% | 2.57% | -0.56% | 10.13% | 13.52% | 15.35% |
| 4.75% | 7.54% | 11.37% | 8.26% | 12.63% | 13.23% | 15.54% | 15.53% | 15.53% | 19.30% | 22.49% | 2.99% | 3.25% | 11.23% | 10.61% | 7.48% |
| 1Life starting dates for TSP funds are August 31, 2004. TSP Coach strategy has been in use since August 2004. 2TSP Coach returns as of 31 days ago. Members can see full returns |
|||||||||||||||
You have a number of choices when choosing a TSP allocation plan—some change many times a month, some twice a month, and some once a month. TSP Coach changes just once a month while delivering outstanding returns.
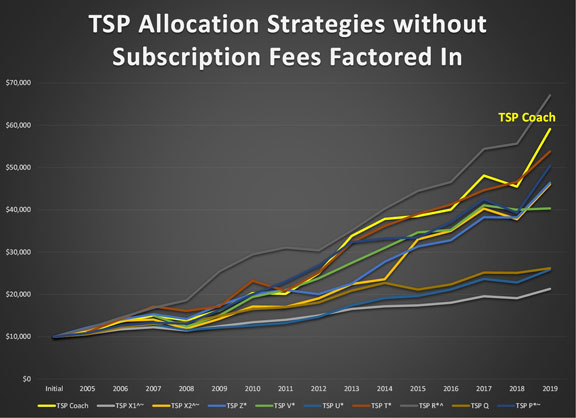
TSP Coach keeps it simple. Below we compare our track record to other fee-based TSP programs (names replaced by letters). Each starts with either $10,000 in 2005 (first full year of our program) or, if they began later, at a value equal to ours for a fair comparison. Services without a detailed public history are omitted.
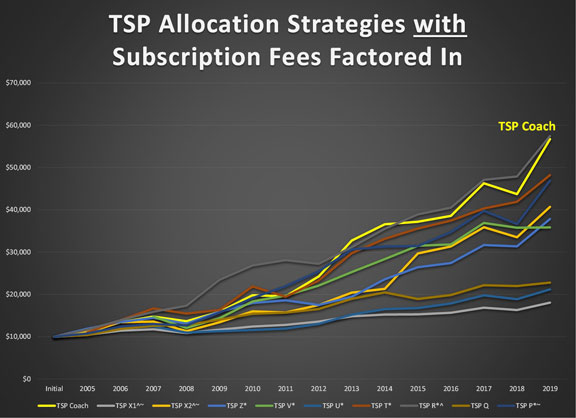
Over the last 21 years, TSP Coach has proven it is the best value we can measure: many competitors cost $200+/year, change strategies often, or trade more than twice a month. Our charts show growth before and after typical subscription fees.
What you would have accumulated following TSP Coach vs other once/twice-a-month plans (no fees deducted yet).
When fees are included, high-priced plans fall further behind—illustrating why low cost matters as much as returns.
Year-by-year comparison table (Year + TSP Coach stay left; scroll for competitors).
| Year | TSP Coach |
|---|---|
| Initial | $10,000 |
| 2005 | $11,038 |
| 2006 | $13,580 |
| 2007 | $14,970 |
| 2008 | $13,638 |
| 2009 | $15,873 |
| 2010 | $19,817 |
| 2011 | $19,438 |
| 2012 | $24,703 |
| 2013 | $33,274 |
| 2014 | $37,429 |
| 2015 | $37,953 |
| 2016 | $39,931 |
| 2017 | $47,015 |
| 2018 | $50,039 |
| 2019 | $64,611 |
| 2020 | $88,760 |
| 2021 | $104,322 |
| 2022 | $88,249 |
| 2023 | $107,824 |
| 2024 | $122,083 |
| CAGR | 13.33% |
| CAGR L10Y | 12.39% |
| CAGR L5Y | 6.58% |
| CAGR L3Y | 11.42% |
| As of: 01/01/2025 |
| TSP X1^ | TSP X2^ | TSP Z* | TSP V* | TSP U* | TSP T* | TSP R*^ | TSP Q | TSP P* |
|---|---|---|---|---|---|---|---|---|
| $10,000 | $10,000 | $10,000 | $10,000 | $10,000 | $10,000 | |||
| $10,460 | $11,140 | $11,920 | $11,038 | $11,038 | $11,665 | $10,414 | $10,755 | |
| $11,429 | $13,452 | $13,478 | $12,040 | $13,945 | $13,909 | $11,850 | $12,389 | |
| $11,759 | $13,585 | $14,474 | $14,970 | $12,483 | $16,739 | $15,913 | $12,602 | $13,011 |
| $10,892 | $11,343 | $13,121 | $13,942 | $11,009 | $15,533 | $17,339 | $12,785 | $12,668 |
| $11,679 | $13,416 | $15,918 | $16,662 | $11,358 | $16,382 | $23,472 | $14,009 | $15,687 |
| $12,405 | $16,003 | $17,973 | $21,324 | $11,631 | $21,963 | $26,881 | $15,437 | $19,174 |
| $12,788 | $15,741 | $18,625 | $22,923 | $11,974 | $19,528 | $28,111 | $15,694 | $21,953 |
| $13,585 | $17,480 | $17,509 | $25,733 | $13,078 | $23,376 | $27,247 | $16,563 | $25,457 |
| $14,834 | $20,441 | $19,445 | $29,493 | $15,274 | $29,873 | $31,189 | $18,981 | $30,632 |
| $15,248 | $21,313 | $23,605 | $33,101 | $16,604 | $33,273 | $35,511 | $20,493 | $31,327 |
| $15,281 | $29,689 | $26,431 | $36,813 | $16,829 | $35,702 | $38,941 | $18,924 | $31,450 |
| $15,681 | $31,350 | $27,416 | $37,225 | $17,941 | $37,583 | $40,523 | $19,863 | $34,732 |
| $16,864 | $35,902 | $31,683 | $43,170 | $19,857 | $40,482 | $47,088 | $22,189 | $39,770 |
| $16,326 | $33,526 | $31,370 | $41,891 | $18,945 | $42,068 | $47,893 | $21,982 | $36,644 |
| $18,054 | $40,719 | $37,830 | $42,026 | $21,279 | $48,402 | $57,456 | $22,803 | |
| $19,246 | $43,971 | $45,272 | $26,076 | $47,317 | $67,068 | $24,971 | ||
| $20,682 | $50,471 | $52,999 | $30,430 | $52,845 | $74,440 | $26,093 | ||
| $19,543 | $44,839 | $36,476 | $41,795 | $53,210 | $66,990 | $24,521 | ||
| $21,681 | $52,207 | $39,927 | $46,728 | $68,462 | $73,510 | $26,832 | ||
| $24,106 | $60,845 | $45,440 | $53,057 | $84,522 | $91,988 | $29,393 | ||
| 4.50% | 9.45% | 6.36% | 8.17% | 10.71% | 11.73% | 5.54% | ||
| 4.66% | 7.44% | 2.13% | 12.17% | 9.00% | 8.98% | 4.50% | ||
| 4.61% | 6.71% | 0.07% | 15.27% | 12.30% | 6.52% | 3.31% | ||
| 7.24% | 10.71% | 7.60% | 8.28% | 16.68% | 11.15% | 6.23% | ||
Ready for once-a-month allocations with a public track record?
We have developed a simple, yet effective, investment program that reallocates our TSP Funds at the end of each month, when necessary.
Start managing your TSP account the way the experts do. We have adapted our program for the true purpose of
the TSP Program, a vehicle for long term investment.
The returns with our program are significantly higher than the fixed
allocation buy and hold strategies employed by the Lifestyle Funds available through TSP,
and our performance outperforms many other TSP subscription services with much lower subscription fees, no emergency, mid-month or large numbers of
TSP allocation changes, just proven returns with end of month TSP Fund allocation and account rebalancing.
We have maximized our returns while
minimizing our risk in a repeatable, consistent manner. Don't delay, subscribe today!
1. Annualized return of 14.01% since its inception in 2004.
2. Simple TSP allocation strategy changes allocations and monthly fund percentages once a month-perfect for all investors.
One allocation change, once a month, at the end of the month, is all I do.
3. Strategy
has not changed in over 21 years.
4. Methodology is rooted in
investment research spanning over five decades. I utilize the Sharpe Ratio
with my own proprietary formula to arrive at my allocation percentages.
5. Most affordable
TSP newsletter around!
By subscribing through PayPal or Square to our information service, you will receive a username and a password via email that will give
you access to our monthly allocation page.
The allocation page will be updated at the end of the last trading day of each month. We will make
an announcement on Twitter @TSPCoach when our allocation page has been updated.
Subscription Prices:
Monthly $7
Yearly $60
Answers to questions I have answered over the years from subscribers.
Disclaimer: I cannot provide advice, only how I invest.
Browse past monthly allocation posts by year. Subscribers see full percentages; guests can still explore the public archive and current post teasers.
TSP limits you to five core funds and only two inter-fund transfers a month. Chasing daily noise is a poor fit. We use the Sharpe Ratio, modern portfolio ideas, and a proprietary formula—and we rebalance at most once per month.
With that simple rule set, we outperform everyone we can fairly measure—at a fraction of many newsletter prices.
Official-style share prices from our database (not live streaming). Use them for context next to the market strip above—or open a fund page for deeper history.
Scroll sideways on mobile to see all Lifecycle and core funds.
See this month’s allocation| Date | L Income | L 2030 | L 2035 | L 2040 | L 2045 | L 2050 | L 2055 | L 2060 | L 2065 | L 2070 | L 2075 | G Fund | F Fund | C Fund | S Fund | I Fund |
|---|---|---|---|---|---|---|---|---|---|---|---|---|---|---|---|---|
| 2026-07-31 | 30.7572 | 62.6825 | 19.2573 | 74.2118 | 20.6242 | 45.8956 | 24.0788 | 24.0756 | 24.0723 | 14.2670 | 12.4622 | 20.0914 | 20.7644 | 120.6031 | 113.9868 | 64.0123 |
| 2026-07-30 | 30.7135 | 62.5106 | 19.1930 | 73.9435 | 20.5446 | 45.7066 | 23.9544 | 23.9513 | 23.9480 | 14.1934 | 12.3979 | 20.0889 | 20.8240 | 119.7571 | 114.4461 | 63.6309 |
| Daily Change | 0.14% | 0.27% | 0.34% | 0.36% | 0.39% | 0.41% | 0.52% | 0.52% | 0.52% | 0.52% | 0.52% | 0.01% | -0.29% | 0.71% | -0.4% | 0.6% |
| Month to Date | 0 | 0 | 0 | 0 | 0 | 0 | 0 | 0 | 0 | 0 | 0 | 0 | 0 | 0 | 0 | 0 |
| Year to Date | 5.18% | 7.89% | 8.93% | 9.48% | 9.96% | 10.45% | 12.36% | 12.36% | 12.36% | 12.36% | 12.36% | 2.57% | -0.56% | 10.13% | 13.52% | 15.35% |
| Details | L Income | L 2030 | L 2035 | L 2040 | L 2045 | L 2050 | L 2055 | L 2060 | L 2065 | L 2070 | L 2075 | G Fund | F Fund | C Fund | S Fund | I Fund |
Questions about the service, billing, or how monthly updates work? We want the product to be clearer for federal and military investors.
TSP Coach was started by a US Navy Officer with over 29 years of investment experience. As an active duty officer, he managed squadron TSP enrollment when it was first implemented in 2003 and is committed to ensuring federal workers have the knowledge to make strong Thrift Savings Plan decisions. He holds an undergraduate degree in Systems Engineering and an MBA from Columbia University.
With retirement rules evolving, maximizing TSP returns matters more than ever. We publish a simple, once-a-month approach at a low subscription price—so you can follow the same discipline we use with our own accounts.
Two additional board members bring CFO and executive experience across industries. We have validated the model through research and a long public track record. We hope you benefit from seeing how we invest our hard-earned money.