Member Login
Become a member of the fastest growing TSP Newsletter
Watch how I maximize my returns while minimizing my risk.
Subscribe Now!
Choose Your Subscription Plan
Monthly @ $7.00
Yearly @ $60.00
You will be directed to PayPal to complete your secure subscription process.
Once complete, you will then be redirected to our registration page.
TSP Coach Risk compared to TSP Funds and Lifecycle Funds
Reduce Risk While Maximizing TSP Returns
| Year1 | TSP Coach |
|---|---|
| 2005 | 2.66% |
| 2006 | 2.46% |
| 2007 | 2.82% |
| 2008 | 4.10% |
| 2009 | 1.85% |
| 2010 | 6.00% |
| 2011 | 5.89% |
| 2012 | 1.89% |
| 2013 | 2.71% |
| 2014 | 2.50% |
| 2015 | 3.69% |
| 2016 | 2.91% |
| 2017 | 0.90% |
| 2018 | 4.38% |
| 2019 | 3.76% |
| 2020 | 8.01% |
| 2021 | 3.02% |
| 2022 | 6.07% |
| 2023 | 4.62% |
| 2024 | 1.51% |
| As of: | 03/07/2025 |
| L Income | L 2025 | L 2030 | L 2035 | L 2040 | L 2045 | L 2050 | L 2055 | L 2060 | L 2065 | G Fund | F Fund | C Fund | S Fund | I Fund |
|---|---|---|---|---|---|---|---|---|---|---|---|---|---|---|
| 0.04% | 0.84% | 2.16% | 3.32% | 2.77% | ||||||||||
| 0.37% | 1.48% | 1.70% | 0.04% | 0.73% | 1.56% | 3.06% | 2.60% | |||||||
| 0.49% | 1.90% | 2.16% | 0.05% | 0.73% | 2.68% | 3.00% | 2.77% | |||||||
| 1.29% | 4.72% | 5.40% | 0.05% | 1.69% | 5.82% | 7.61% | 7.47% | |||||||
| 1.36% | 4.78% | 5.45% | 0.03% | 0.92% | 6.16% | 7.12% | 7.65% | |||||||
| 1.07% | 3.91% | 4.49% | 0.04% | 0.80% | 5.32% | 6.07% | 6.56% | |||||||
| 0.95% | 3.38% | 3.89% | 0.04% | 0.64% | 4.41% | 6.00% | 5.43% | |||||||
| 0.65% | 2.30% | 2.64% | 0.01% | 0.56% | 2.91% | 3.44% | 4.59% | |||||||
| 0.51% | 1.68% | 1.94% | 0.03% | 0.88% | 2.35% | 2.89% | 3.29% | |||||||
| 0.49% | 1.61% | 1.87% | 0.01% | 0.63% | 2.28% | 3.48% | 2.71% | |||||||
| 0.71% | 2.36% | 2.72% | 0.02% | 0.82% | 3.78% | 3.58% | 4.11% | |||||||
| 0.59% | 1.96% | 2.29% | 0.02% | 1.03% | 2.84% | 4.47% | 3.47% | |||||||
| 0.16% | 0.50% | 0.59% | 0.01% | 0.43% | 1.09% | 1.42% | 1.17% | |||||||
| 0.77% | 2.34% | 2.79% | 0.02% | 0.86% | 4.24% | 4.92% | 3.45% | |||||||
| 0.69% | 2.06% | 2.47% | 0.03% | 0.95% | 3.56% | 4.68% | 3.16% | |||||||
| 1.63% | 4.54% | 5.43% | 0.03% | 0.95% | 7.18% | 10.19% | 7.30% | |||||||
| 0.62% | 1.21% | 1.61% | 1.76% | 1.91% | 2.05% | 2.18% | 2.63% | 2.63% | 2.63% | 0.02% | 0.79% | 3.05% | 3.29% | 2.76% |
| 1.59% | 2.62% | 3.79% | 4.16% | 4.52% | 4.83% | 5.13% | 6.05% | 6.05% | 6.06% | 0.07% | 2.34% | 6.21% | 6.87% | 6.42% |
| 1.21% | 1.72% | 2.76% | 3.04% | 3.31% | 3.54% | 3.76% | 4.39% | 4.39% | 4.39% | 0.04% | 2.35% | 4.07% | 6.44% | 4.60% |
| 0.36% | 0.45% | 0.75% | 0.82% | 0.88% | 0.94% | 1.00% | 1.23% | 1.23% | 1.23% | 0.13% | 0.39% | 1.51% | 1.85% | 0.77% |
| 1Life starting dates for TSP funds are August 31, 2004. TSP Coach strategy has been in use since August 2004. | ||||||||||||||
This table shows the risk based on monthly returns for each of the TSP Funds, Lifecycle Funds and TSP Coach. My TSP Fund allocations have reduced my risk, but does not lower it to levels that inhibit my returns. While I utilize the Sharpe Ratio in my calculations, and risk is an important part of this equation, I also perform proprietary calculations to ensure that the often times conservative nature of the Sharpe Ratio does not limit the performance of my Thrift Savings Plan investments.
TSP Coach vs Other TSP Strategies
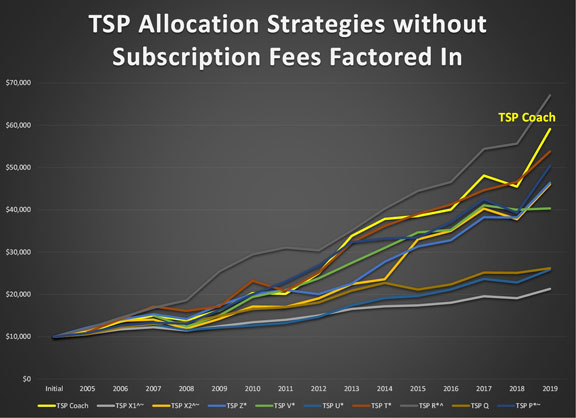
This chart is a comparison of TSP Coach to all TSP plans that change allocations once or twice a month.

Only the TSP 'R' Fund beats TSP Coach - before fees. The ^ means it used to trade more than 2 times a month before the restriction was put in place. It also has an annual subscription fee of $260/year.
TSP Coach vs Other TSP Strategies with Fees Included
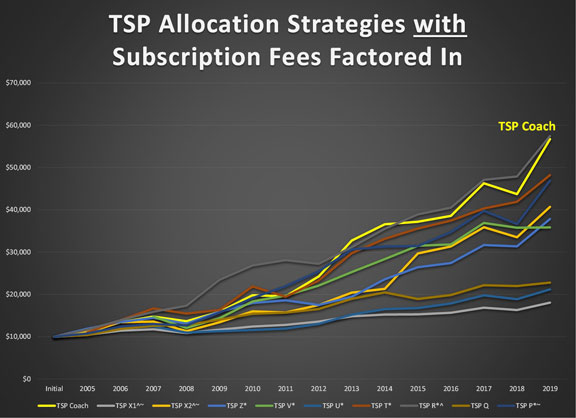
This chart is a comparison of the TSP Coach to the same plans, this time with Subscription Fees factored in.

TSP Coach has beaten all competitors over the last 20 years, and therefore, we fulfil our mission statement of achieving the best returns with the lowest fees. We want our program accessible to TSP investors just starting out on their journey towards retirement.
Calculation Data Behind the Charts Above
This is my data table for all of the TSP plans analyzed in the previous chart. The percentages do not include any subscription fees.
| Year | TSP Coach |
|---|---|
| Initial | $10,000 |
| 2005 | $11,002 |
| 2006 | $13,440 |
| 2007 | $14,758 |
| 2008 | $13,652 |
| 2009 | $15,894 |
| 2010 | $19,804 |
| 2011 | $19,577 |
| 2012 | $24,250 |
| 2013 | $32,748 |
| 2014 | $36,579 |
| 2015 | $37,192 |
| 2016 | $38,589 |
| 2017 | $46,277 |
| 2018 | $43,715 |
| 2019 | $56,723 |
| CAGR | 12.27% |
| CAGR L10Y | 11.10% |
| CAGR L5Y | 8.81% |
| CAGR L3Y | 7.02% |
| TSP X1^ | TSP X2^ | TSP Z* | TSP V* | TSP U* | TSP T* | TSP R*^ | TSP Q | TSP P* |
|---|---|---|---|---|---|---|---|---|
| $10,000 | $10,000 | $10,000 | $10,000 | $10,000 | $10,000 | |||
| $10,460 | $11,140 | $11,920 | $11,002 | $11,002 | $11,665 | $10,414 | $10,755 | |
| $11,429 | $13,452 | $13,478 | $12,000 | $13,899 | $13,909 | $11,850 | $12,389 | |
| $11,759 | $13,585 | $14,474 | $14,758 | $12,441 | $16,683 | $15,913 | $12,602 | $13,011 |
| $10,892 | $11,343 | $13,121 | $12,044 | $10,971 | $15,480 | $17,339 | $12,785 | $12,668 |
| $11,679 | $13,416 | $15,918 | $14,366 | $11,319 | $16,326 | $23,472 | $14,009 | $15,687 |
| $12,405 | $16,003 | $17,973 | $18,359 | $11,589 | $21,887 | $26,881 | $15,436 | $19,174 |
| $12,788 | $15,741 | $18,625 | $19,708 | $11,931 | $19,460 | $28,111 | $15,693 | $21,953 |
| $13,585 | $17,480 | $17,509 | $22,096 | $13,030 | $23,294 | $27,247 | $16,563 | $25,457 |
| $14,834 | $20,441 | $19,445 | $25,296 | $15,218 | $29,767 | $31,189 | $18,981 | $30,632 |
| $15,248 | $21,313 | $23,605 | $28,362 | $16,542 | $33,155 | $35,511 | $20,493 | $31,327 |
| $15,281 | $29,689 | $26,431 | $31,514 | $16,765 | $35,575 | $38,941 | $18,924 | $31,450 |
| $15,681 | $31,350 | $27,416 | $31,837 | $17,872 | $37,449 | $40,523 | $19,863 | $34,732 |
| $16,864 | $35,902 | $31,683 | $36,894 | $19,780 | $40,337 | $47,088 | $22,189 | $39,770 |
| $16,326 | $33,526 | $31,370 | $35,771 | $18,871 | $41,916 | $47,893 | $21,982 | $36,644 |
| $18,054 | $40,718 | $37,830 | $35,858 | $21,195 | $48,226 | $57,456 | $22,803 | $46,919 |
| 4.02% | 9.81% | 9.28% | 7.07% | 4.47% | 10.35% | 12.36% | 5.65% | 10.86% |
| 3.82% | 9.79% | 7.73% | 6.92% | 6.22% | 8.22% | 7.89% | 3.98% | 9.36% |
| 3.39% | 6.52% | 7.43% | 2.62% | 4.80% | 6.27% | 8.09% | 3.80% | 8.33% |
| 2.30% | 4.29% | 6.09% | -0.95% | 2.33% | 6.14% | 6.86% | 0.91% | 5.67% |
* > 2 trades/mo
^ > 2 trades/mo before 2007
~ Numbers on website have changed from 2015
I started with an initial value of $10,000 on January 1, 2005 and then compared my returns to other
fee based TSP newsletters based on the information available on their websites.
In cases where their programs started after 2005, I started them at the TSP Coach end of year fund
value in order to provide an easy comparison. Additional comments are noted in the table.
Contact Us
Success!
Submission Failed

